07
empreses
continguts
Empreses. DIRCE
Empreses. DIRCE per cond. jurídica i nombre d'assalariats
| Número | Alacant | C. Valenc. | Espanya | % Alac. s/C.Val. | % Alac. s/Espanya | ||||
| 2020 | 2021 | % 21/20 | 2021 | % 21/20 | 2021 | % 21/20 | 2021 | 2021 | |
| Total | 145.431 | 144.573 | -0,6% | 368.044 | -0,7% | 3.366.570 | -1,1% | 39,3% | 4,3% |
| Per condició jurídica | |||||||||
| Societats anònimes | 1.348 | 1.253 | -7,0% | 3.894 | -5,9% | 60.510 | -4,6% | 32,2% | 2,1% |
| Societats responsab. limitada | 54.633 | 53.703 | -1,7% | 130.319 | -0,9% | 1.134.632 | -0,8% | 41,2% | 4,7% |
| Societats col·lectives | 3 | 4 | 33,3% | 8 | 0,0% | 119 | -4,8% | 50,0% | 3,4% |
| Societats comandit. | 2 | 2 | 0,0% | 6 | 20,0% | 72 | 0,0% | 33,3% | 2,8% |
| Comunit. de béns | 5.412 | 5.270 | -2,6% | 14.387 | -3,3% | 113.358 | -2,7% | 36,6% | 4,6% |
| Societats cooperat. | 736 | 744 | 1,1% | 2.399 | -0,7% | 20.808 | -1,4% | 31,0% | 3,6% |
| Associac. i altres tipus | 3.944 | 3.914 | -0,8% | 13.399 | 0,4% | 149.002 | -1,1% | 29,2% | 2,6% |
| Organism. autònoms i altres | 272 | 257 | -5,5% | 858 | -2,8% | 8.949 | -0,8% | 30,0% | 2,9% |
| Persones físiques | 79.081 | 79.426 | 0,4% | 202.774 | -0,3% | 1.879.120 | -1,1% | 39,2% | 4,2% |
| Per nombre d'assalariats | |||||||||
| Sense assalariats | 80.824 | 79.860 | -1,2% | 200.474 | -1,5% | 1.879.126 | -1,7% | 39,8% | 4,2% |
| D'1 a 2 | 39.457 | 40.451 | 2,5% | 103.782 | 1,9% | 920.321 | 1,4% | 39,0% | 4,4% |
| De 3 a 5 | 13.516 | 13.567 | 0,4% | 34.532 | 0,6% | 304.095 | -0,6% | 39,3% | 4,5% |
| De 6 a 9 | 5.418 | 5.193 | -4,2% | 13.639 | -3,2% | 120.828 | -3,7% | 38,1% | 4,3% |
| De 10 a 19 | 3.568 | 3.147 | -11,8% | 8.471 | -7,9% | 75.522 | -7,1% | 37,2% | 4,2% |
| De 20 a 49 | 1.845 | 1.655 | -10,3% | 4.639 | -8,4% | 42.012 | -8,9% | 35,7% | 3,9% |
| De 50 a 99 | 480 | 394 | -17,9% | 1.279 | -11,5% | 11.959 | -9,9% | 30,8% | 3,3% |
| De 100 a 199 | 203 | 181 | -10,8% | 679 | -3,8% | 6.655 | -3,6% | 26,7% | 2,7% |
| De 200 a 249 | 31 | 35 | 12,9% | 143 | 25,4% | 1.380 | 1,3% | 24,5% | 2,5% |
| De 250 a 999 | 75 | 75 | 0,0% | 331 | -5,7% | 3.634 | -3,7% | 22,7% | 2,1% |
| De 1000 a 4999 | 12 | 12 | 0,0% | 66 | 3,1% | 867 | -1,5% | 18,2% | 1,4% |
| De 5000 o més | 2 | 3 | 50,0% | 9 | 12,5% | 171 | -0,6% | 33,3% | 1,8% |
| Font: INE Institut Nacional d'Estadística | |||||||||
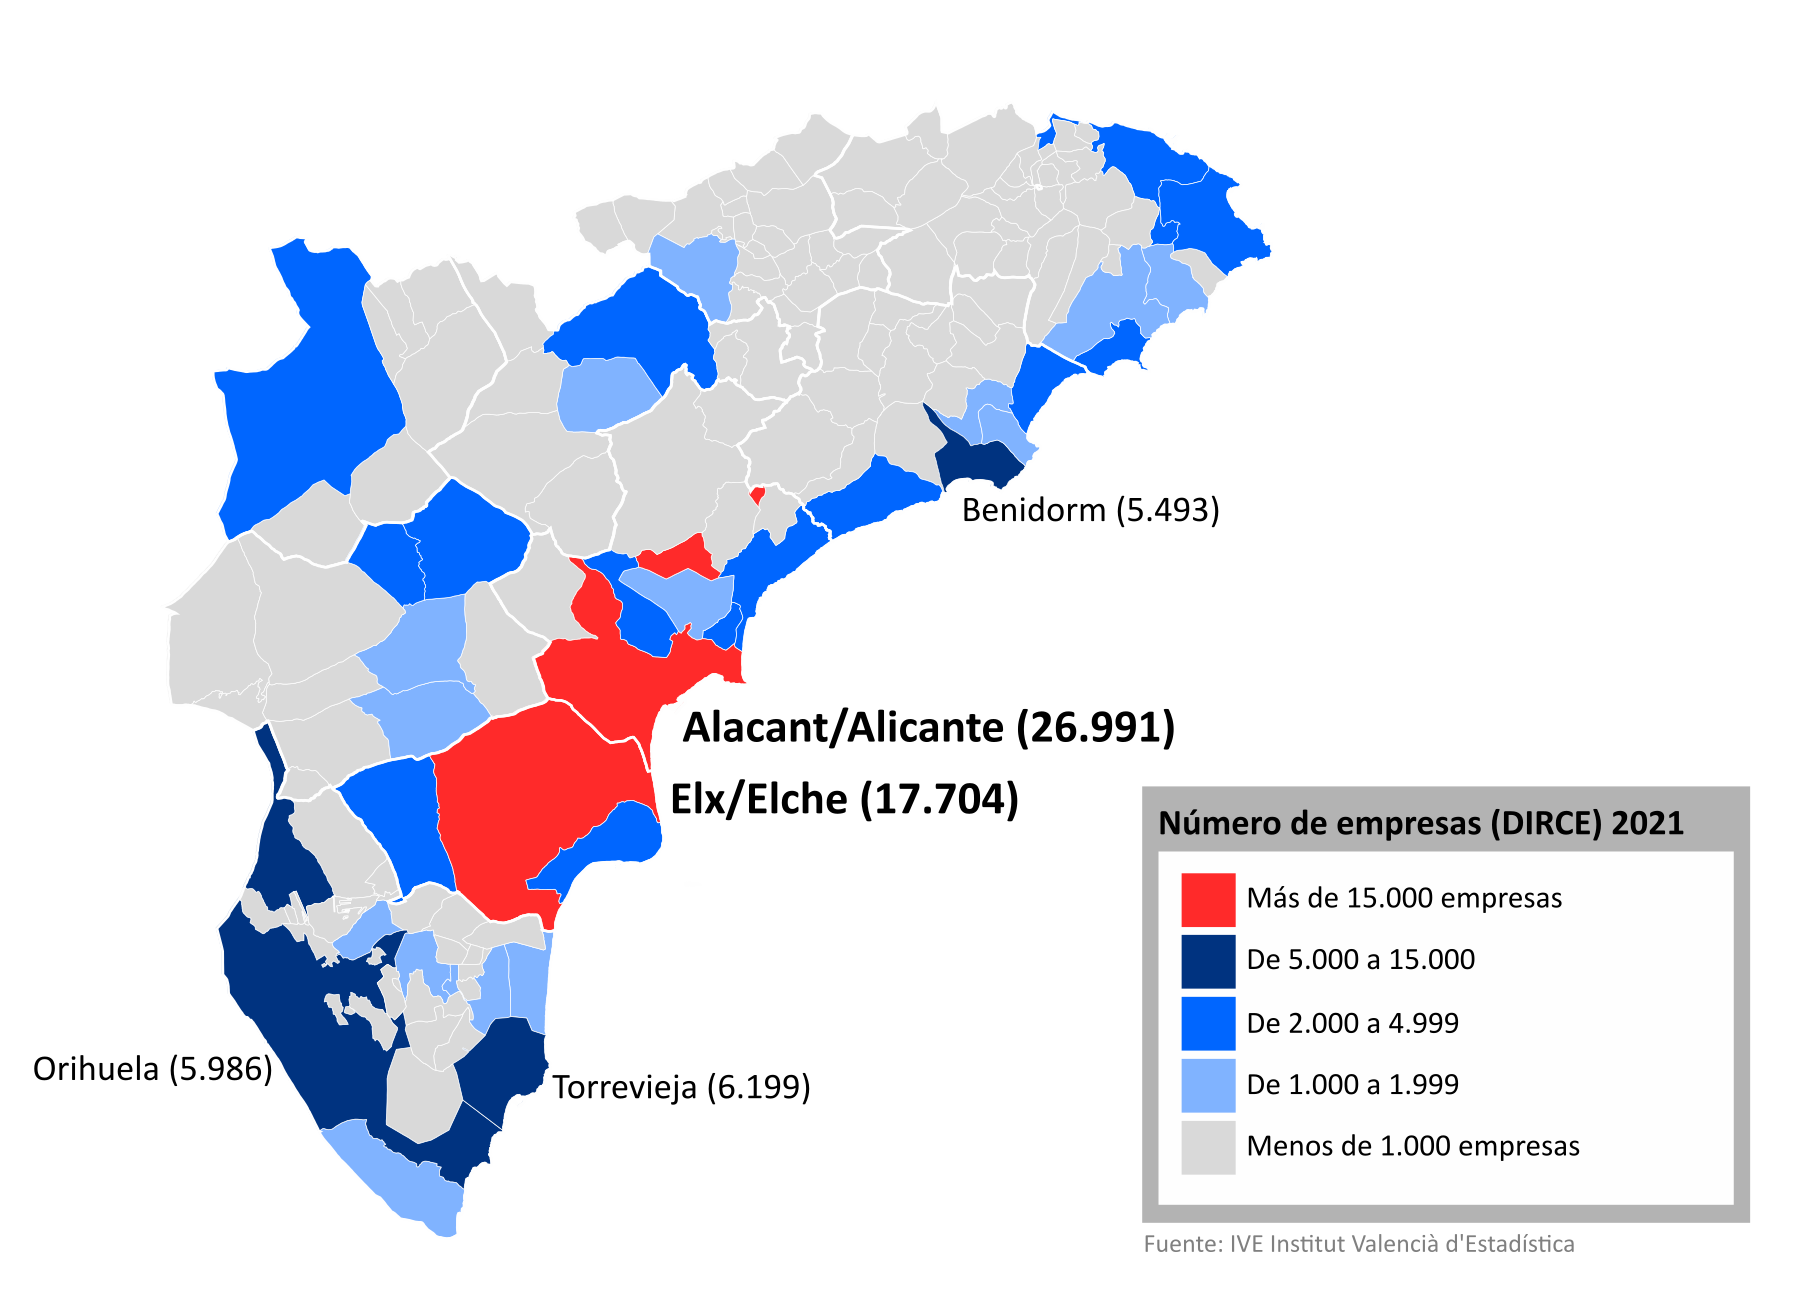
Distribució de les empreses (DIRCE) per municipis
Locals. DIRCE
| Número | Alacant | C. Valenc. | Espanya | % Alac. s/C.Val. | % Alac. s/Espanya | ||||
| 2020 | 2021 | % 21/20 | 2021 | % 21/20 | 2021 | % 21/20 | 2021 | 2021 | |
| Total | 168.458 | 167.645 | -0,5% | 423.092 | -0,5% | 3.871.933 | -0,9% | 39,6% | 4,3% |
| Agrupació pròpia a partir de la CNAE 2009 | |||||||||
| Indústria | 11.960 | 11.609 | -2,9% | 28.388 | -2,1% | 231.198 | -1,6% | 40,9% | 5,0% |
| Extractives | 103 | 104 | 1,0% | 286 | -0,7% | 2.955 | -2,8% | 36,4% | 3,5% |
| Alimentació, begudes i tabac | 1.151 | 1.136 | -1,3% | 3.103 | -1,1% | 36.881 | -0,7% | 36,6% | 3,1% |
| Tèxtil-confecció | 1.189 | 1.194 | 0,4% | 2.665 | -1,4% | 17.008 | -0,6% | 44,8% | 7,0% |
| Cuiro i calçat | 2.480 | 2.294 | -7,5% | 2.432 | -7,6% | 4.601 | -5,1% | 94,3% | 49,9% |
| Fuesta i moble | 784 | 765 | -2,4% | 2.773 | -2,8% | 22.881 | -2,3% | 27,6% | 3,3% |
| Paper i arts gràfiques | 726 | 731 | 0,7% | 2.002 | -0,1% | 17.110 | -1,9% | 36,5% | 4,3% |
| Química | 193 | 210 | 8,8% | 814 | 3,7% | 5.683 | 1,4% | 25,8% | 3,7% |
| Cautxú i plàstic | 566 | 566 | 0,0% | 1.045 | -1,6% | 5.177 | -1,1% | 54,2% | 10,9% |
| Min. no metàl. (marbre, sal) | 549 | 536 | -2,4% | 1.532 | -2,4% | 9.903 | -2,6% | 35,0% | 5,4% |
| Metalls i prod. metál. | 1.362 | 1.330 | -2,3% | 3.509 | -2,1% | 37.597 | -1,4% | 37,9% | 3,5% |
| Maq. i prod. mecànics, electr. | 421 | 412 | -2,1% | 1.412 | -1,3% | 12.195 | -1,7% | 29,2% | 3,4% |
| Material de transport | 76 | 71 | -6,6% | 311 | 4,7% | 3.538 | -0,3% | 22,8% | 2,0% |
| Joguets i similars | 544 | 520 | -4,4% | 1.330 | -3,8% | 10.689 | -1,9% | 39,1% | 4,9% |
| Altres indústries | 646 | 647 | 0,2% | 1.776 | 0,6% | 16.178 | -0,2% | 36,4% | 4,0% |
| Energia i agua | 1.170 | 1.093 | -6,6% | 3.398 | -3,2% | 28.802 | -3,0% | 32,2% | 3,8% |
| Construcció | 21.811 | 21.753 | -0,3% | 49.323 | -0,6% | 454.373 | -0,7% | 44,1% | 4,8% |
| Serveis | 134.687 | 134.283 | -0,3% | 345.381 | -0,3% | 3.186.362 | -0,9% | 38,9% | 4,2% |
| Comerç i reparacions | 42.655 | 41.922 | -1,7% | 102.726 | -1,3% | 887.333 | -1,5% | 40,8% | 4,7% |
| Transport i emmagatzematge | 5.887 | 6.098 | 3,6% | 20.852 | 3,4% | 230.081 | 2,6% | 29,2% | 2,7% |
| Turisme | 15.901 | 15.687 | -1,3% | 35.344 | -1,4% | 311.990 | -2,5% | 44,4% | 5,0% |
| Informació i comunicacions | 2.617 | 2.703 | 3,3% | 7.764 | 3,1% | 80.215 | 1,1% | 34,8% | 3,4% |
| Serveis financers | 4.437 | 4.347 | -2,0% | 12.120 | -1,5% | 111.968 | -1,3% | 35,9% | 3,9% |
| Serveis immobiliàris | 12.054 | 12.071 | 0,1% | 26.166 | 1,6% | 216.836 | 1,7% | 46,1% | 5,6% |
| Altres serveis | 51.136 | 51.455 | 0,6% | 140.409 | -0,2% | 1.347.939 | -1,2% | 36,6% | 3,8% |
| Font: INE Institut Nacional d'Estadística | |||||||||
Empreses inscrites a la Seg. Social* (Rég. General i Carbó). Mitjana anual
| Nombre** | Alacant | C. Valenc. | Espanya | % Alac. s/C.Val. | % Alac. s/Espanya | ||||
| 2020 | 2021 | % 21/20 | 2021 | % 21/20 | 2021 | % 21/20 | 2021 | 2021 | |
| Total | 57.574 | 58.165 | 1,0% | 147.201 | 1,3% | 1.301.461 | 1,7% | 39,5% | 4,5% |
| Por sector d'activitat | |||||||||
| Sector agrari | 2.011 | 2.011 | 0,0% | 6.026 | -1,7% | 97.992 | 1,6% | 33,4% | 2,1% |
| Indústria | 5.780 | 5.845 | 1,1% | 14.811 | 0,5% | 106.350 | 0,4% | 39,5% | 5,5% |
| Construcció | 6.144 | 6.392 | 4,0% | 15.466 | 5,4% | 133.804 | 5,4% | 41,3% | 4,8% |
| Serveis | 43.639 | 43.917 | 0,6% | 110.897 | 1,0% | 963.315 | 1,3% | 39,6% | 4,6% |
| *Règim General (exclosos els S.E. Agrari i Empleats de la Llar) i Règ. Esp. Carbó Font: Ministeri de Treball i Economia Social | |||||||||