04
producció
Producte Interior Brut (PIB) a preus de mercat. % participació
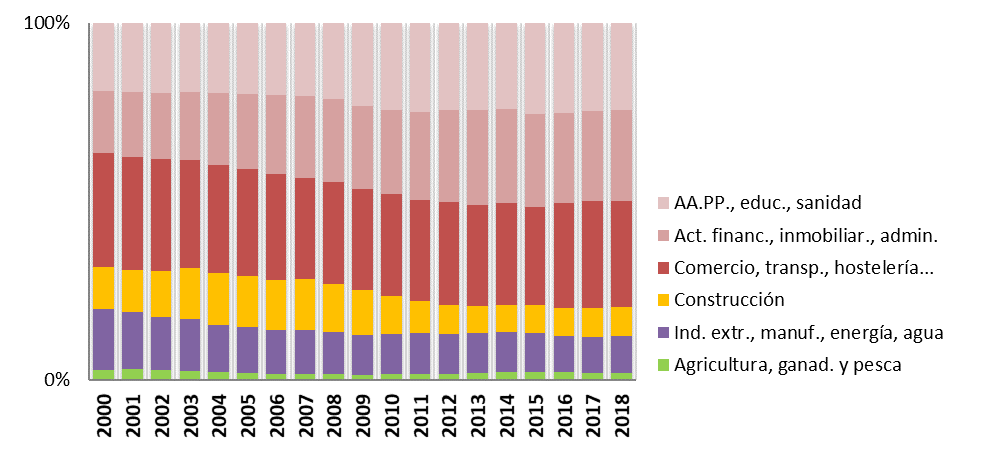
Evolució de l'aportació sectorial al VAB. Província d′Alacant
Producte Interior Brut (PIB) a preus de mercat
| Alacant | C. Valenc. | Espanya | % Alac. s/C.Val. | % Alac. s/Espanya | |||||
| 2019 | 2020 | % 19/20 | 2020 | % 19/20 | 2020 | % 19/20 | 2019 | 2019 | |
| Total | 37.688 | 104.724 | -9,3% | 1.121.948 | -9,8% | 32,7% | 3,0% | ||
| Agricultura, ramad. i pesca | 600 | 2.413 | 10,1% | 35.319 | 9,4% | 27,4% | 1,9% | ||
| Ind. extr., manuf., energia, aigua | 3.382 | 18.331 | -6,7% | 164.803 | -8,4% | 17,2% | 1,9% | ||
| Ind. manufacturera | 2.756 | 14.476 | -7,8% | 123.716 | -9,2% | 17,5% | 2,0% | ||
| Construcció | 2.866 | 6.552 | -10,3% | 63.742 | -9,9% | 39,2% | 4,1% | ||
| Comerç, transp., hostaleria, infor. i comun. | 10.343 | 20.437 | -20,7% | 202.246 | -24,2% | 40,1% | 3,9% | ||
| Act. financ., immobiliàr., admin. | 8.709 | 25.747 | -2,8% | 304.876 | -4,3% | 32,9% | 2,7% | ||
| AA.PP., educ., sanitat | 8.277 | 22.113 | -4,8% | 253.135 | -2,6% | 35,6% | 3,2% | ||
| Valor afegit brut total | 34.178 | 95.593 | -8,7% | 1.024.121 | -9,2% | 32,7% | 3,0% | ||
| Impostos nets s/prod. | 3.510 | 9.131 | -15,0% | 97.827 | -15,6% | 32,7% | 3,0% | ||
| Font: INE Institut Nacional d'Estadística | |||||||||