02 Población Distribución de la población empadronada por municipios
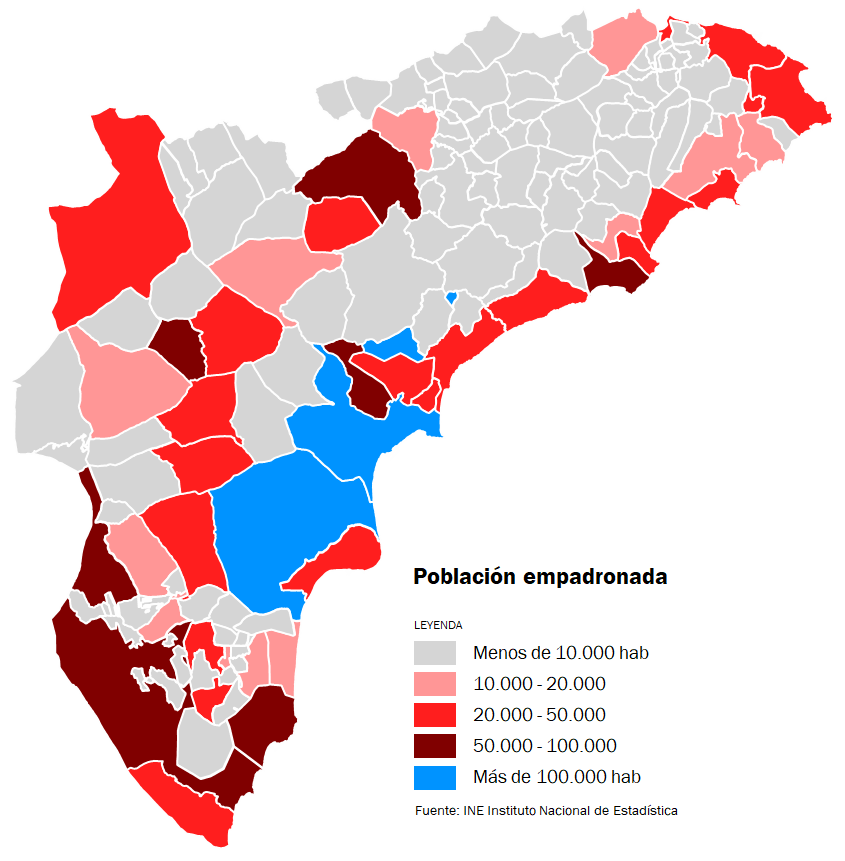
Distribución de la población empadronada por municipios
Últimos datos. Anuales
| Personas | Población a 1 de enero de 2022 |
| Total | % s/tot | Por sexo | Nº de
municipios | % s/tot |
| Hombres | Mujeres |
| Provincia de Alicante | 1.901.594 | 100,0% | 941.361 | 960.233 | 141 | 100,0% |
| Menos de 101 hab. | 171 | 0,0% | 97 | 74 | 3 | 2,1% |
| De 101 a 500 hab. | 7.663 | 0,4% | 3.896 | 3.767 | 28 | 19,9% |
| De 501 a 1.000 hab. | 13.720 | 0,7% | 7.008 | 6.712 | 20 | 14,2% |
| De 1.001 a 2.000 hab. | 18.545 | 1,0% | 9.404 | 9.141 | 13 | 9,2% |
| De 2.001 a 5.000 hab. | 59.985 | 3,2% | 30.050 | 29.935 | 18 | 12,8% |
| De 5.001 a 10.000 hab. | 166.018 | 8,7% | 83.882 | 82.136 | 22 | 15,6% |
| De 10.001 a 20.000 hab. | 152.776 | 8,0% | 76.593 | 76.183 | 11 | 7,8% |
| De 20.001 a 50.000 hab. | 504.095 | 26,5% | 250.622 | 253.473 | 18 | 12,8% |
| De 50.001 a 100.000 hab. | 404.464 | 21,3% | 199.330 | 205.134 | 6 | 4,3% |
| Más de 100.000 hab. | 574.157 | 30,2% | 280.479 | 293.678 | 2 | 1,4% |
| Fuente: INE Instituto Nacional de Estadística |
| Población a 1 de enero de 2022 | Extensión (km2) | Densidad (hab/km2) |
Total | % s/total | Por sexo |
Hombres | Mujeres |
| Provincia de Alicante | 1.901.594 | 100,0% | 941.361 | 960.233 | 5.817,5 | 326,9 |
| Atzúbia, l' | 616 | 0,0% | 319 | 297 | 14,7 | 41,9 |
| Agost | 4.948 | 0,3% | 2.502 | 2.446 | 66,6 | 74,3 |
| Agres | 589 | 0,0% | 325 | 264 | 25,8 | 22,8 |
| Aigües | 1.085 | 0,1% | 549 | 536 | 18,5 | 58,6 |
| Albatera | 12.864 | 0,7% | 6.519 | 6.345 | 66,5 | 193,4 |
| Alcalalí | 1.349 | 0,1% | 672 | 677 | 14,4 | 93,7 |
| Alcosser | 254 | 0,0% | 125 | 129 | 4,7 | 54,0 |
| Alcoleja | 196 | 0,0% | 105 | 91 | 14,6 | 13,4 |
| Alcoy/Alcoi | 58.960 | 3,1% | 28.912 | 30.048 | 129,9 | 453,9 |
| Alfafara | 417 | 0,0% | 199 | 218 | 19,8 | 21,1 |
| Alfàs del Pi, l' | 20.668 | 1,1% | 10.226 | 10.442 | 19,3 | 1.070,9 |
| Algorfa | 3.513 | 0,2% | 1.777 | 1.736 | 18,4 | 190,9 |
| Algueña | 1.351 | 0,1% | 681 | 670 | 18,5 | 73,0 |
| Alicante/Alacant | 338.577 | 17,8% | 163.548 | 175.029 | 200,8 | 1.686,1 |
| Almoradí | 21.401 | 1,1% | 10.737 | 10.664 | 42,7 | 501,2 |
| Almudaina | 112 | 0,0% | 55 | 57 | 8,8 | 12,7 |
| Alqueria d'Asnar, l' | 489 | 0,0% | 246 | 243 | 0,7 | 698,6 |
| Altea | 23.010 | 1,2% | 11.305 | 11.705 | 34,4 | 668,9 |
| Aspe | 21.191 | 1,1% | 10.671 | 10.520 | 70,9 | 298,9 |
| Balones | 126 | 0,0% | 66 | 60 | 11,2 | 11,3 |
| Banyeres de Mariola | 7.201 | 0,4% | 3.633 | 3.568 | 50,3 | 143,2 |
| Benasau | 171 | 0,0% | 82 | 89 | 9,0 | 19,0 |
| Beneixama | 1.705 | 0,1% | 852 | 853 | 34,9 | 48,9 |
| Benejúzar | 5.480 | 0,3% | 2.754 | 2.726 | 9,3 | 589,2 |
| Benferri | 1.955 | 0,1% | 1.016 | 939 | 12,4 | 157,7 |
| Beniarbeig | 2.267 | 0,1% | 1.156 | 1.111 | 7,4 | 306,4 |
| Beniardá | 218 | 0,0% | 106 | 112 | 15,7 | 13,9 |
| Beniarrés | 1.078 | 0,1% | 555 | 523 | 20,2 | 53,4 |
| Benigembla | 512 | 0,0% | 255 | 257 | 18,4 | 27,8 |
| Benidoleig | 1.232 | 0,1% | 606 | 626 | 7,5 | 164,3 |
| Benidorm | 69.738 | 3,7% | 34.629 | 35.109 | 38,5 | 1.811,4 |
| Benifallim | 106 | 0,0% | 56 | 50 | 13,7 | 7,7 |
| Benifato | 139 | 0,0% | 74 | 65 | 11,9 | 11,7 |
| Benijófar | 3.427 | 0,2% | 1.667 | 1.760 | 4,4 | 778,9 |
| Benilloba | 740 | 0,0% | 387 | 353 | 9,5 | 77,9 |
| Benillup | 108 | 0,0% | 58 | 50 | 3,4 | 31,8 |
| Benimantell | 499 | 0,0% | 251 | 248 | 37,9 | 13,2 |
| Benimarfull | 410 | 0,0% | 213 | 197 | 5,6 | 73,2 |
| Benimassot | 93 | 0,0% | 51 | 42 | 9,5 | 9,8 |
| Benimeli | 419 | 0,0% | 194 | 225 | 3,5 | 119,7 |
| Benissa | 11.871 | 0,6% | 5.846 | 6.025 | 69,7 | 170,3 |
| Benitachell/Poble Nou de Benitatxell, el | 4.687 | 0,2% | 2.283 | 2.404 | 12,7 | 369,1 |
| Biar | 3.612 | 0,2% | 1.770 | 1.842 | 98,2 | 36,8 |
| Bigastro | 7.130 | 0,4% | 3.591 | 3.539 | 4,1 | 1.739,0 |
| Bolulla | 413 | 0,0% | 214 | 199 | 13,6 | 30,4 |
| Busot | 3.343 | 0,2% | 1.686 | 1.657 | 33,9 | 98,6 |
| Calp | 24.096 | 1,3% | 12.058 | 12.038 | 23,5 | 1.025,4 |
| Callosa d'en Sarrià | 7.653 | 0,4% | 3.953 | 3.700 | 34,7 | 220,5 |
| Callosa de Segura | 19.315 | 1,0% | 9.832 | 9.483 | 24,8 | 778,8 |
| Campello, el | 29.409 | 1,5% | 14.314 | 15.095 | 55,3 | 531,8 |
| Campo de Mirra/Camp de Mirra, el | 433 | 0,0% | 223 | 210 | 21,8 | 19,9 |
| Cañada | 1.191 | 0,1% | 594 | 597 | 19,3 | 61,7 |
| Castalla | 11.097 | 0,6% | 5.646 | 5.451 | 114,6 | 96,8 |
| Castell de Castells | 426 | 0,0% | 225 | 201 | 45,9 | 9,3 |
| Catral | 8.976 | 0,5% | 4.509 | 4.467 | 20,0 | 448,8 |
| Cocentaina | 11.298 | 0,6% | 5.683 | 5.615 | 52,8 | 214,0 |
| Confrides | 282 | 0,0% | 154 | 128 | 40,0 | 7,1 |
| Cox | 7.431 | 0,4% | 3.766 | 3.665 | 16,8 | 442,3 |
| Crevillent | 29.881 | 1,6% | 15.120 | 14.761 | 104,5 | 285,9 |
| Quatretondeta | 133 | 0,0% | 73 | 60 | 16,7 | 8,0 |
| Daya Nueva | 1.758 | 0,1% | 860 | 898 | 7,1 | 247,6 |
| Daya Vieja | 683 | 0,0% | 338 | 345 | 3,1 | 220,3 |
| Dénia | 43.899 | 2,3% | 21.350 | 22.549 | 66,2 | 663,1 |
| Dolores | 7.799 | 0,4% | 3.893 | 3.906 | 18,7 | 417,1 |
| Elche/Elx | 235.580 | 12,4% | 116.931 | 118.649 | 326,1 | 722,4 |
| Elda | 52.297 | 2,8% | 25.483 | 26.814 | 45,8 | 1.141,9 |
| Fageca | 104 | 0,0% | 53 | 51 | 10,2 | 10,2 |
| Famorca | 48 | 0,0% | 26 | 22 | 9,6 | 5,0 |
| Finestrat | 7.909 | 0,4% | 4.059 | 3.850 | 42,2 | 187,4 |
| Formentera del Segura | 4.446 | 0,2% | 2.268 | 2.178 | 4,3 | 1.034,0 |
| Gata de Gorgos | 6.364 | 0,3% | 3.235 | 3.129 | 20,3 | 313,5 |
| Gaianes | 548 | 0,0% | 277 | 271 | 9,6 | 57,1 |
| Gorga | 270 | 0,0% | 144 | 126 | 9,1 | 29,7 |
| Granja de Rocamora | 2.626 | 0,1% | 1.355 | 1.271 | 7,2 | 364,7 |
| Castell de Guadalest, el | 258 | 0,0% | 129 | 129 | 16,0 | 16,1 |
| Guardamar del Segura | 16.138 | 0,8% | 7.852 | 8.286 | 35,6 | 453,3 |
| Fondó de les Neus, el/Hondón de las Nieves | 2.684 | 0,1% | 1.388 | 1.296 | 68,8 | 39,0 |
| Hondón de los Frailes | 1.261 | 0,1% | 639 | 622 | 12,6 | 100,1 |
| Ibi | 23.677 | 1,2% | 11.872 | 11.805 | 62,5 | 378,8 |
| Jacarilla | 2.039 | 0,1% | 1.035 | 1.004 | 12,2 | 167,1 |
| Xaló | 2.931 | 0,2% | 1.469 | 1.462 | 34,6 | 84,7 |
| Jávea/Xàbia | 28.731 | 1,5% | 14.346 | 14.385 | 68,6 | 418,8 |
| Jijona/Xixona | 6.860 | 0,4% | 3.317 | 3.543 | 163,8 | 41,9 |
| Lorcha/Orxa, l' | 565 | 0,0% | 283 | 282 | 31,8 | 17,8 |
| Llíber | 967 | 0,1% | 481 | 486 | 21,9 | 44,2 |
| Millena | 243 | 0,0% | 131 | 112 | 9,8 | 24,8 |
| Monforte del Cid | 8.619 | 0,5% | 4.502 | 4.117 | 79,5 | 108,4 |
| Monóvar/Monòver | 12.387 | 0,7% | 6.167 | 6.220 | 152,4 | 81,3 |
| Mutxamel | 26.192 | 1,4% | 13.088 | 13.104 | 47,7 | 549,1 |
| Murla | 540 | 0,0% | 254 | 286 | 5,8 | 93,1 |
| Muro de Alcoy | 9.303 | 0,5% | 4.646 | 4.657 | 30,5 | 305,0 |
| Novelda | 25.592 | 1,3% | 12.691 | 12.901 | 75,7 | 338,1 |
| Nucia, la | 18.624 | 1,0% | 9.442 | 9.182 | 21,4 | 870,3 |
| Ondara | 7.085 | 0,4% | 3.563 | 3.522 | 10,4 | 681,3 |
| Onil | 7.580 | 0,4% | 3.796 | 3.784 | 48,4 | 156,6 |
| Orba | 2.348 | 0,1% | 1.156 | 1.192 | 17,7 | 132,7 |
| Orxeta | 812 | 0,0% | 414 | 398 | 24,1 | 33,7 |
| Orihuela | 80.784 | 4,2% | 40.021 | 40.763 | 365,4 | 221,1 |
| Parcent | 997 | 0,1% | 496 | 501 | 11,8 | 84,5 |
| Pedreguer | 8.280 | 0,4% | 4.129 | 4.151 | 29,6 | 279,7 |
| Pego | 10.295 | 0,5% | 5.113 | 5.182 | 52,9 | 194,6 |
| Penàguila | 287 | 0,0% | 148 | 139 | 49,9 | 5,8 |
| Petrer | 33.978 | 1,8% | 16.816 | 17.162 | 104,2 | 326,1 |
| Pinós, el/Pinoso | 8.084 | 0,4% | 4.097 | 3.987 | 126,9 | 63,7 |
| Planes | 695 | 0,0% | 375 | 320 | 38,9 | 17,9 |
| Polop | 5.186 | 0,3% | 2.636 | 2.550 | 22,6 | 229,5 |
| Rafal | 4.634 | 0,2% | 2.299 | 2.335 | 1,6 | 2.896,3 |
| Ràfol d'Almúnia, el | 731 | 0,0% | 371 | 360 | 4,9 | 149,2 |
| Redován | 8.123 | 0,4% | 4.219 | 3.904 | 9,4 | 864,1 |
| Relleu | 1.171 | 0,1% | 613 | 558 | 76,9 | 15,2 |
| Rojales | 16.943 | 0,9% | 8.564 | 8.379 | 27,6 | 613,9 |
| Romana, la | 2.605 | 0,1% | 1.370 | 1.235 | 43,3 | 60,2 |
| Sagra | 435 | 0,0% | 208 | 227 | 5,6 | 77,7 |
| Salinas | 1.678 | 0,1% | 861 | 817 | 61,7 | 27,2 |
| Sanet y Negrals | 734 | 0,0% | 364 | 370 | 3,9 | 188,2 |
| San Fulgencio | 9.091 | 0,5% | 4.573 | 4.518 | 19,7 | 461,5 |
| Sant Joan d'Alacant | 24.450 | 1,3% | 11.789 | 12.661 | 9,6 | 2.546,9 |
| San Miguel de Salinas | 6.659 | 0,4% | 3.343 | 3.316 | 54,9 | 121,3 |
| Santa Pola | 36.174 | 1,9% | 18.186 | 17.988 | 58,6 | 617,3 |
| San Vicente del Raspeig/Sant Vicent del Raspeig | 59.138 | 3,1% | 29.262 | 29.876 | 40,5 | 1.460,2 |
| Sax | 9.988 | 0,5% | 5.011 | 4.977 | 63,5 | 157,3 |
| Sella | 592 | 0,0% | 307 | 285 | 38,7 | 15,3 |
| Senija | 623 | 0,0% | 321 | 302 | 4,8 | 129,8 |
| Tàrbena | 624 | 0,0% | 328 | 296 | 31,7 | 19,7 |
| Teulada | 11.944 | 0,6% | 5.929 | 6.015 | 32,2 | 370,9 |
| Tibi | 1.731 | 0,1% | 906 | 825 | 70,4 | 24,6 |
| Tollos | 30 | 0,0% | 20 | 10 | 14,6 | 2,1 |
| Tormos | 332 | 0,0% | 161 | 171 | 5,3 | 62,6 |
| Torremanzanas/Torre de les Maçanes, la | 683 | 0,0% | 365 | 318 | 36,5 | 18,7 |
| Torrevieja | 83.547 | 4,4% | 41.023 | 42.524 | 71,4 | 1.170,1 |
| Vall d'Alcalà, la | 164 | 0,0% | 90 | 74 | 24,2 | 6,8 |
| Vall d'Ebo, la | 219 | 0,0% | 113 | 106 | 32,4 | 6,8 |
| Vall de Gallinera, la | 579 | 0,0% | 304 | 275 | 53,6 | 10,8 |
| Vall de Laguar, la | 890 | 0,0% | 444 | 446 | 23,1 | 38,5 |
| Verger, el | 4.986 | 0,3% | 2.470 | 2.516 | 8,2 | 608,0 |
| Villajoyosa/Vila Joiosa, la | 34.828 | 1,8% | 17.259 | 17.569 | 59,2 | 588,3 |
| Villena | 33.969 | 1,8% | 17.041 | 16.928 | 345,6 | 98,3 |
| Poblets, els | 2.735 | 0,1% | 1.288 | 1.447 | 3,6 | 759,7 |
| Pilar de la Horadada | 22.949 | 1,2% | 11.753 | 11.196 | 77,9 | 294,6 |
| Montesinos, Los | 5.217 | 0,3% | 2.657 | 2.560 | 15,1 | 345,5 |
| San Isidro | 2.154 | 0,1% | 1.111 | 1.043 | 6,7 | 321,5 |
| Fuente: INE Instituto Nacional de Estadística |
Distribución de la población empadronada por municipios
Últimos datos. Anuales